Recap of EOSS-47
Graphs created with data found in the spread sheet file for EOSS-47.

I'm not sure, but I believe there is an unwritten law about posting graphs about a balloon flight which states you must include the above chart.
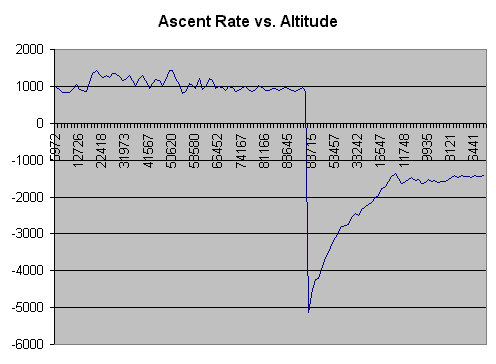
OK, it's standard stuff, but ... look at the tail end of the flight and you will see a flattening out of the descent rate. Well, not really.
The cross band repeater goes into a rapid reporting mode once the payload is below 20K feet. This way, were sure to get a final packet really close to the ground. If the balloon sent out a packet once each minute, and the surface winds were high, we might find the payload as much as several miles from it's last airborne packet transmission. However with the system beaconing out every ten seconds, we are pretty likely to have a station hear it's last report while the balloon is only a couple of hundred feet in the air. And it should land fairly close to that position report.

Here is the ascent rate for EOSS-47. I haven't overlaid any trend lines because I think it's pretty visible. The balloon's ascent rate is constantly decreasing. And that slow rate at takeoff, beats me. I leave it to the experts to interpret this type of info.

This is a representation of the speed as calculated by comparing two consecutive packets, overlaid on top of the GPS speed reported at the instant the second packet was assembled for transmission. We've never had quite as easy a data format to work with so this was the first time I really got a chance to see how my calculations in Balloon Track stacked up against real world data.
I actually "trust" my data more for the purposes of predicting a touchdown location for the payload as it isn't subject to very brief transients in the wind speed. It is an average speed for the balloon during the interval between two packets.

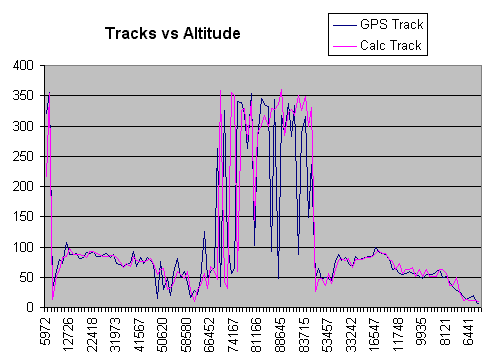
Again, the reported GPS track vs. a calculated track between two consecutive packets. You can see the GPS moves around quite a bit here. I'll still stick with my "average" information for touchdown predictions.
